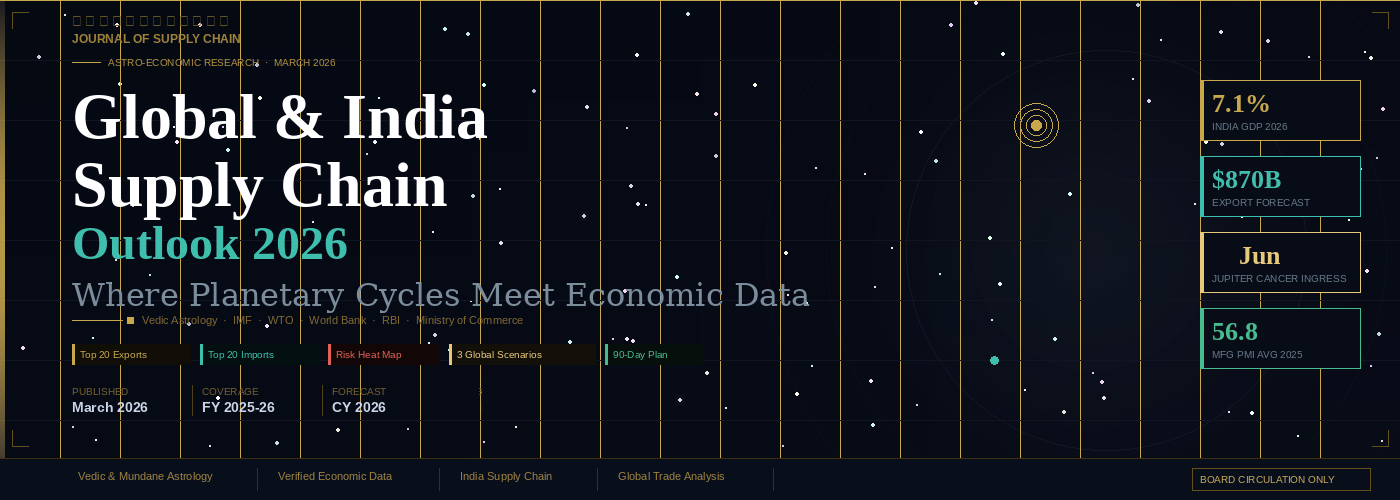
Summary
India stands at a rare and consequential inflection point in 2026. Three powerful forces are converging simultaneously: (1) robust domestic economic fundamentals — GDP growth of 6.8-7.1%, manufacturing PMI sustained above 56, and Rs.11.1 trillion in government capital expenditure deployed; (2) a secular structural shift in global trade as corporations accelerate China+1 diversification strategies; and (3) a rare astronomical configuration — Jupiter's 12-year ingress into Cancer in June 2026 — which historically coincides with India's peak periods of foreign trade expansion and capital inflows.
The 2025 global supply chain environment was defined by moderate resilience amid ongoing fragmentation. World GDP grew at 3.2% (IMF), trade volume expanded by 2.9%, and container freight rates declined sharply from pandemic-era peaks. India outperformed with 6.8% GDP growth, $795 billion in exports, and significant logistics infrastructure milestones including port throughput reaching 795 million tonnes and Dedicated Freight Corridors progressively commissioned.
Looking ahead to 2026, our base case (55% probability) projects global GDP growth of 3.4% and India GDP at 7.1%, with Indian exports reaching $870 billion. The primary risks are external: a US-China decoupling shock, energy price spike, or currency depreciation event. Saturn's continued influence in governance houses demands institutional discipline. The stars, the data, and the strategy all point in the same direction: India's decade of trade leadership begins now.
1: Astro-Economic Foundation
1.1 India Independence Chart (August 15, 1947)
Mundane astrology analyses the horoscope of nations, institutions, and macroeconomic cycles using the birth chart of that entity. India's independence chart, cast for August 15, 1947 at midnight IST in New Delhi, forms the bedrock of this astrological analysis. The Ascendant (Lagna) is Taurus — a fixed earth sign ruled by Venus — symbolising stability, agricultural wealth, material prosperity, and trade-centred national identity.
Key planetary placements and their economic significance:
1.2 Key Planetary Transits: 2025-2026
|
Planet |
Position (2025-26) |
Economic Domain |
Implication for India |
|
Jupiter |
Taurus to Gemini (Apr 2025) |
Trade, Expansion |
Activates 1st and 2nd houses — national wealth expansion; Gemini phase drives tech trade, logistics innovation. |
|
Saturn |
Aquarius (Retrograde Jun-Nov 2025) |
Governance, Structure |
10th house influence for Taurus Lagna — institutional restructuring; government policy reform. |
|
Rahu |
Pisces (11th House India) |
Foreign Networks |
Amplifies foreign partnerships, digital trade, pharma exports, and overseas capital inflows. |
|
Ketu |
Virgo (5th House India) |
Speculation |
Disrupts speculative investments; volatility in derivative markets. |
|
Pluto |
Aquarius (long-cycle) |
Structural Transformation |
Decade-scale reshaping of global manufacturing order. India positioned as primary beneficiary. |
|
Uranus |
Gemini (from 2025) |
Technology Disruption |
AI-enabled logistics, automated supply chains, digital trade infrastructure revolution. |
|
Mars |
Multiple signs |
Geopolitical Tension |
Mars-Saturn conjunctions Q1 and Q3 2026 signal geopolitical friction and commodity price spikes. |
The Aries Ingress charts for 2025 and 2026 reinforce these themes. The 2026 Aries Ingress chart places Jupiter in a prominent angular position relative to India's natal chart, amplifying the expansion signals. Eclipse cycles — particularly the Solar Eclipse in Pisces (April 8, 2026) — create short-term volatility windows before a strong recovery phase as Jupiter enters Cancer in June 2026.
2: Global Supply Chain — 2025 Review
2.1 Macroeconomic Environment
The 2025 global economy demonstrated resilience in the face of persistent structural headwinds. According to IMF projections as of October 2025, global GDP growth reached approximately 3.2% — modestly above the 3.1% recorded in 2024 but below the pre-pandemic trend of 3.8%. The developed world continued to decelerate, while emerging and developing economies provided the growth engine
|
Indicator |
2024 Actual |
2025 Estimate |
Source |
|
Global GDP Growth |
3.1% |
3.2% |
IMF World Economic Outlook |
|
World Trade Volume Growth |
2.6% |
2.9% |
WTO Trade Barometer |
|
Global Inflation (CPI) |
5.8% |
4.3% |
IMF / World Bank |
|
Emerging Market Growth |
4.3% |
4.8% |
World Bank GEP Report |
|
US Federal Funds Rate |
5.25-5.50% |
4.75-5.00% |
US Federal Reserve |
|
Brent Crude Oil (Annual Avg) |
$84/bbl |
$92/bbl |
EIA Petroleum Outlook |
|
Container Throughput Growth |
+3.8% |
+4.1% |
UNCTAD Review of Maritime |
|
Baltic Dry Index (Year Avg) |
1,520 |
1,650 |
Baltic Exchange |
2.2 Logistics & Freight Markets
The 2025 freight markets underwent a significant normalisation after pandemic-era distortions. Shanghai Containerized Freight Index (SCFI) rates declined sharply year-on-year: Transpacific rates fell approximately 18% while Asia-Europe lanes compressed by 32%. Ocean carriers responded by implementing slow steaming and blank sailings to support rate floors.
Astrological Interpretation: Saturn's transit through Aquarius (10th house from India's Taurus Lagna) symbolised the institutional restructuring observed in global supply chains. The WTO's reform agenda stalled as bilateral and regional trade deals proliferated — a Saturn-in-10th archetypal pattern of authority fragmentation and structural reorganisation.
2.3 Supply Chain Pressure Index
The Global Supply Chain Pressure Index (GSCPI), published by the New York Federal Reserve, declined from elevated pandemic levels to near-neutral territory in 2025, suggesting that acute disruption pressures had largely normalised. However, structural vulnerabilities in semiconductor supply chains, pharmaceutical API sourcing, and rare earth metal procurement remained elevated. Climate-driven disruptions (drought affecting Panama Canal capacity, flooding in key industrial zones) introduced episodic volatility.
3: Global Supply Chain — 2026 Forecast
3.1 Scenario Analysis Framework
Our 2026 global outlook is structured around three scenarios, each reflecting a distinct combination of geopolitical conditions, monetary policy trajectories, and commodity market dynamics. The scenarios are informed by both quantitative economic modelling and astrological cycle analysis.
1. Scenario A: Base Case (Probability 55%)
Continued moderate global expansion with GDP growth of 3.4%, trade volume growth of 3.5%, and mild freight rate inflation of 8-12% driven by demand recovery and capacity discipline.
2. Scenario B: High Volatility (Probability 30%)
Triggered by Mars-Saturn square in March 2026 (geopolitical conflict trigger), Solar Eclipse in Pisces (April 2026), or significant escalation in Middle East or Taiwan Strait tensions.
3. Scenario C: Structural Reset (Probability 15%)
Full US-China trade decoupling, European recession, and persistent energy crisis — consistent with the Pluto in Aquarius long-cycle symbolism of decade-scale structural transformation.
Recommendation: Plan operations for Scenario A. Stress-test Scenario B quarterly. Scenario C requires dedicated tail-risk governance and strategic optionality framework.
4: India Supply Chain — 2025 Review
4.1 Macroeconomic Performance
India delivered another year of world-leading economic growth in FY2025-26. GDP grew at approximately 6.8% (IMF/CSO), maintaining India's position as the fastest-growing major economy globally. This performance was underpinned by strong domestic consumption, robust services exports, continued government capital expenditure, and the PLI scheme bearing fruit across multiple sectors.
|
Indicator |
2025 Value |
Notes / Source |
|
GDP Growth Rate |
6.8% |
IMF / CSO; fastest major economy globally |
|
Total Merchandise Exports |
$795 Billion |
Ministry of Commerce; +8.2% YoY |
|
Total Merchandise Imports |
$960 Billion |
Ministry of Commerce |
|
Trade Deficit |
-$165 Billion |
Manageable; $650B+ forex reserves as buffer |
|
Manufacturing PMI (Average) |
56.8 |
S&P Global PMI; 24th consecutive expansion month |
|
Services PMI (Average) |
58.4 |
S&P Global India Services PMI |
|
Government Capex |
Rs.11.1 Trillion |
Union Budget FY2025-26 allocation |
|
Forex Reserves |
$650 Billion+ |
RBI; 10+ months import cover |
|
PLI Scheme Commitments |
Rs.1.97 Lakh Crore |
DPIIT; across 14 sectors |
4.2 Logistics & Infrastructure Milestones
5: India Supply Chain — 2026 Forecast
5.1 Trade Balance Trajectory
India's trade deficit is projected to narrow in 2026, from -$165 billion to approximately -$130 billion, as export growth (+9.4% to $870 billion) outpaces import growth (+4.2% to $1.0 trillion). Crude oil remains the key variable; every $10/barrel movement translates to approximately $15 billion in import bill changes.
|
Sector |
2025 Value |
2026 Forecast |
Key Driver |
|
Electronics & Mobile Devices |
$31.2B |
$50B+ |
Apple/Samsung PLI ecosystem deepening |
|
Pharmaceuticals |
$28.9B |
$38B |
US generic patent cliff; API self-sufficiency |
|
Engineering Goods |
$115.8B |
$130B+ |
Defense exports $3B+; capital goods demand |
|
Digital Services / IT |
$220B+ |
$250B+ |
GCC expansion; AI services boom |
|
Textiles & Apparel |
$18.4B |
$22B |
China+1 beneficiary; ASEAN FTA leverage |
|
Chemicals |
$25.3B |
$30B |
Specialty chemicals, F&F, agrochemicals |
|
Defense Equipment |
$2.7B |
$4B+ |
+68% CAGR; government target $5B by 2027 |
5.2 Planetary Forecast for India (2026)
Jupiter's ingress into Cancer in June 2026 is the most significant planetary event for India's national chart in the 2026 cycle. Cancer is the 3rd house from India's Taurus Lagna — governing communications, trade with neighbouring nations, transportation, and short-range connectivity. Jupiter's expansion energy in the 3rd house historically correlates with export volume surges, logistics investment cycles, and growth in regional trade agreements. This is a once-in-12-year opportunity window.
The Solar Eclipse in Pisces (April 8, 2026) activates India's 11th house — the house of gains, networks, and foreign income. Eclipse activations of the 11th house typically trigger short-term market volatility (2-4 weeks) followed by a strong recovery and inflow cycle. Boards should anticipate potential rupee volatility and FPI outflows in March-April 2026, followed by renewed accumulation from June onward as Jupiter enters Cancer.
Mercury Retrograde periods (April and August 2026) require buffer time for contract finalisations and trade agreement implementations. Build 2-week contingency windows into all major commercial timelines during these periods.
6: India's Top 20 Export Commodities
The following table presents India's top 20 export commodities by trade value (FY2024-25), their share of total exports, year-on-year growth, planetary rulers in Vedic astrology, and 2026 strategic outlook with risk classification.
|
# |
Commodity |
Value |
Share |
YoY |
Planet |
2026 Outlook |
Risk Level |
|
1 |
Petroleum Products (Refined) |
$88.2B |
11.1% |
+4.2% |
Saturn |
Moderate (+5-8%) |
Oil price risk |
|
2 |
Gems & Jewellery |
$42.1B |
5.3% |
-2.1% |
Venus |
Stable (+3%) |
USD demand |
|
3 |
Engineering Goods |
$115.8B |
14.6% |
+8.7% |
Mars |
Strong (+12-15%) |
Low |
|
4 |
Pharma / Drug Formulations |
$28.9B |
3.6% |
+9.2% |
Saturn/Mercury |
Strong (+14%) |
USFDA risk |
|
5 |
Electronic Goods |
$31.2B |
3.9% |
+22.4% |
Mercury |
Very Strong (+28%) |
Low |
|
6 |
Chemical & Allied Products |
$25.3B |
3.2% |
+5.1% |
Pluto |
Moderate (+8%) |
Dumping |
|
7 |
Textile & RMG |
$18.4B |
2.3% |
+3.8% |
Venus |
Moderate (+10%) |
China comp. |
|
8 |
Marine Products |
$7.9B |
1.0% |
-4.2% |
Neptune |
Flat-Mild recovery |
Climate risk |
|
9 |
Rice |
$12.1B |
1.5% |
+6.4% |
Moon |
Moderate (+5%) |
Export ban risk |
|
10 |
Iron Ore |
$6.2B |
0.8% |
-8.1% |
Mars |
Weak recovery |
China demand |
|
11 |
Cotton / Yarn / Fabric |
$11.8B |
1.5% |
-1.2% |
Mercury |
Mild (+4%) |
Monsoon risk |
|
12 |
Plastic / Linoleum |
$10.7B |
1.3% |
+7.2% |
Pluto |
Strong (+9%) |
Low |
|
13 |
Spices |
$4.1B |
0.5% |
+12.3% |
Mars |
Very Strong (+15%) |
Low |
|
14 |
Leather & Products |
$3.8B |
0.5% |
+2.1% |
Saturn |
Stable |
Competition |
|
15 |
Ores & Minerals |
$5.6B |
0.7% |
+3.5% |
Saturn |
Moderate |
Env. Regulation |
|
16 |
Oil Meals (De-oiled Cake) |
$3.5B |
0.4% |
+18.2% |
Moon |
Strong (+12%) |
Low |
|
17 |
Cashew Nuts |
$1.6B |
0.2% |
+4.5% |
Jupiter |
Moderate |
Low |
|
18 |
Auto & Auto Components |
$22.7B |
2.9% |
+11.4% |
Mars |
Strong (+15-18%) |
Low |
|
19 |
Defense Equipment |
$2.7B |
0.3% |
+68.2% |
Mars |
Very Strong (+50%) |
Geopolitical |
|
20 |
IT/Software Services (Goods) |
$8.2B |
1.0% |
+9.1% |
Mercury |
Strong (+12%) |
Low |
7: India's Top 20 Import Commodities
India's import basket reflects structural dependence on energy, technology inputs, and precious metals. The following analysis highlights critical dependencies, strategic vulnerabilities, and 2026 outlook for each commodity group.
|
# |
Commodity |
Value |
Share |
YoY |
Planet |
2026 Outlook |
Dependency |
|
1 |
Crude Petroleum & Products |
$210.5B |
21.9% |
+3.2% |
Saturn |
Moderate (+5-8%) |
CRITICAL |
|
2 |
Electronic Goods |
$134.8B |
14.0% |
+11.4% |
Mercury |
Rising (+12%) |
HIGH |
|
3 |
Gold & Precious Metals |
$67.5B |
7.0% |
+14.6% |
Venus/Sun |
Rising (+10%) |
HIGH |
|
4 |
Coal, Coke & Briquettes |
$34.2B |
3.6% |
-6.3% |
Saturn |
Declining (-8%) |
MODERATE |
|
5 |
Machinery (excl. Electric) |
$32.1B |
3.3% |
+8.9% |
Mars |
Rising (+12%) |
MODERATE |
|
6 |
Chemical & Allied Products |
$28.7B |
3.0% |
+4.1% |
Pluto |
Moderate (+6%) |
MODERATE |
|
7 |
Vegetable Oils |
$20.3B |
2.1% |
-2.8% |
Venus |
Stable |
MODERATE |
|
8 |
Electric Machinery & Equipment |
$25.4B |
2.6% |
+16.7% |
Mercury |
Strong Rising (+18%) |
HIGH |
|
9 |
Ferrous & Non-Ferrous Metals |
$19.8B |
2.1% |
+5.4% |
Mars |
Moderate (+5%) |
MODERATE |
|
10 |
Telecom Instruments |
$22.1B |
2.3% |
+9.3% |
Mercury/Rahu |
Rising (+11%) |
HIGH |
|
11 |
Transport Equipment |
$15.9B |
1.7% |
+7.2% |
Mars |
Moderate (+8%) |
LOW |
|
12 |
Medical & Scientific Instruments |
$8.4B |
0.9% |
+5.1% |
Mercury |
Stable (+6%) |
MODERATE |
|
13 |
Fertilisers |
$9.7B |
1.0% |
-9.2% |
Saturn |
Declining |
LOW |
|
14 |
Paper, Paperboard & Products |
$4.9B |
0.5% |
+3.6% |
Mercury |
Stable |
LOW |
|
15 |
Organic & Inorganic Chemicals |
$11.2B |
1.2% |
+4.2% |
Pluto |
Moderate (+5%) |
MODERATE |
|
16 |
Aircraft & Parts |
$6.8B |
0.7% |
+18.4% |
Jupiter |
Strong Rising (+22%) |
MODERATE |
|
17 |
Plastic & Synthetic Rubber |
$8.3B |
0.9% |
+6.1% |
Pluto |
Moderate (+7%) |
LOW |
|
18 |
Pulses |
$3.2B |
0.3% |
+2.4% |
Moon |
Stable |
LOW |
|
19 |
Dairy Products |
$2.1B |
0.2% |
+5.3% |
Moon |
Stable |
LOW |
|
20 |
Silver & Other Precious Metals |
$5.6B |
0.6% |
+22.1% |
Moon/Venus |
Rising (+15%) |
MODERATE |
8: Geopolitical & Risk Synthesis
8.1 Risk Heat Map 2026
|
Risk Factor |
Impact |
Probability |
Astro Trigger |
Window |
Mitigation Strategy |
|
US-China Trade War Escalation |
CRITICAL |
HIGH |
Saturn-Pluto square |
Q1, Q3 |
Supply chain diversification |
|
Middle East Energy Disruption |
CRITICAL |
MEDIUM |
Mars-Saturn conjunct |
Q1, Q2 |
Strategic reserve + hedging |
|
Taiwan Strait Tension |
HIGH |
MEDIUM |
Rahu eclipse Pisces |
Q2 |
Electronics supply buffer |
|
India-Pakistan Border Flare |
HIGH |
LOW |
Mars Scorpio transit |
Q3 |
Border trade exposure review |
|
European Recession |
MODERATE |
MEDIUM |
Saturn 12th house EU |
Q1-Q2 |
Export market diversification |
|
Rupee Depreciation >Rs.90 |
HIGH |
LOW |
Ketu 5th speculative |
Q3, Q4 |
FX hedging; USD export billing |
|
Monsoon Failure |
MODERATE |
LOW |
Moon-Ketu axis |
Q2, Q3 |
Agri commodity buffer stocks |
|
Red Sea / Suez Disruption |
HIGH |
MEDIUM |
Neptune + Rahu Pisces |
Q1, Q2 |
Route diversification; air contingency |
|
AI Logistics Disruption |
MODERATE |
HIGH |
Uranus Gemini ingress |
Q2-Q4 |
Tech investment; re-skilling |
|
El Nino / Climate Event |
MODERATE |
MEDIUM |
Neptune Pisces |
Q2, Q3 |
Climate-resilient supply chain design |
8.2 High-Risk Windows: 2026 Timeline
9: Executive Strategy Synthesis
9.1 Current State Assessment
1. Strengths
2. Weaknesses
3. Strategic Risks
9.2 Strategic Options
Option A: Conservative (Stabilise & Optimise)
Option B: Balanced Expansion (RECOMMENDED)
Option C: Aggressive (Structural Leadership)
9.3 Top 5 Priority Initiatives — Next 90 Days
|
# |
Initiative |
Owner |
Cost Level |
Target KPI |
|
1 |
Activate China+1 Export Acceleration Programme |
Ministry of Commerce + Industry Bodies |
Moderate |
Export order book +15% within 90 days |
|
2 |
Launch AI-Powered National Logistics Platform |
MoRTH + Private 3PL Partners |
High |
Logistics cost -1.5% GDP by FY27 |
|
3 |
Execute 12-Month Crude Oil Price Hedge (50% exposure) |
CFO / Ministry of Petroleum |
Low |
FX savings $2-3B annually |
|
4 |
Scale PLI Electronics Disbursement to 90% target |
MeitY + PLI Nodal Officers |
Low |
Electronics exports $50B target by FY27 |
|
5 |
Conclude & Implement GCC and UK FTA |
Ministry of External Affairs + Commerce |
Low |
New market access $30B+ in 2 years |
9.4 Decision Framework — Rule-Based Logic
|
Trigger |
Threshold |
Decision Action |
|
Freight Rates |
Spike >30% on any major lane |
Activate 6-month inventory buffer protocol; review supplier diversification |
|
USD/INR Rate |
Crosses Rs.88 |
Hedge 50% of remaining unhedged import exposure immediately |
|
Crude Oil |
Brent > $110/bbl sustained |
Trigger SPR drawdown; accelerate domestic energy substitution |
|
China FDI |
Pullback >20% in any PLI sector |
Accelerate FTA negotiations with Vietnam and Mexico; activate backup suppliers |
|
PLI Disbursement |
Below 70% of target |
Escalate to Cabinet Committee on Economic Affairs; deploy expedited approvals |
|
Monsoon |
Below 90% of LPA |
Pre-position agri buffer stocks; review food export ban policy |
|
Geopolitical Escalation |
Mars-Saturn hard aspect + news event |
Convene Emergency Supply Chain War Room; activate dual-source procurement |
The One-Hour Brief
The Single Insight
Jupiter entering Cancer in June 2026 opens a once-in-12-year window for India to cement its position as the world's preferred trade partner. This planetary cycle historically coincides with India's peak export expansion and FDI inflow periods. The last equivalent cycle (Jupiter in Cancer, 2013-14) saw India's exports surge 8.4% and FDI inflows jump 26%. Miss this window, and the next equivalent astronomical configuration is 2037.
The Single Action
Convene a CEO-level, cross-sectoral Export Acceleration Task Force by April 2026. Align India's top 10 export sectors with three FTA ratification timelines and the PLI disbursement calendar — before Jupiter's Cancer ingress activates maximum inflow opportunity in June 2026. This task force should meet weekly, report to the highest authority, and have power to remove bureaucratic bottlenecks within 30-day sprint cycles.
Closing - The Astro-Economic Convergence
The convergence of Jupiter's 12-year expansion cycle (entering Cancer, June 2026), India's infrastructure inflection (Rs.11.1 trillion capex deployed), and the secular China+1 diversification mega-trend creates a multi-year tailwind for Indian supply chains that is without modern precedent. Saturn's continued influence in governance houses demands institutional discipline — the nations and companies that pair bold commercial vision with operational rigour will own the next decade of global trade flows.
The stars are aligned. The question for leadership is not whether, but how fast.
This is not astrology replacing analysis. This is astrology completing analysis — adding the temporal intelligence that quantitative models alone cannot provide. The data confirms the direction. The planetary cycles confirm the timing. The only variable is the courage of leadership to act with both urgency and wisdom.
-- Founder, Journal of Supply Chain | March 2026
This report is prepared for board-level circulation. All astrological interpretations are synthesised with verified economic data sources including IMF, WTO, World Bank, RBI, and Ministry of Commerce. Planetary correlations are observational and should be used as one lens among multiple analytical frameworks in strategic decision-making.
Explore the latest edition of Journal of Supply Chain Magazine and be part of the JOSC News Bulletin.
Discover all our upcoming events and secure your tickets today.
Journal of Supply Chain is a Hansi Bakis Media brand.
Subscribe to our Daily Newsletter
Subscribe For FreeBy continuing you agree to our Privacy Policy & Terms & Conditions