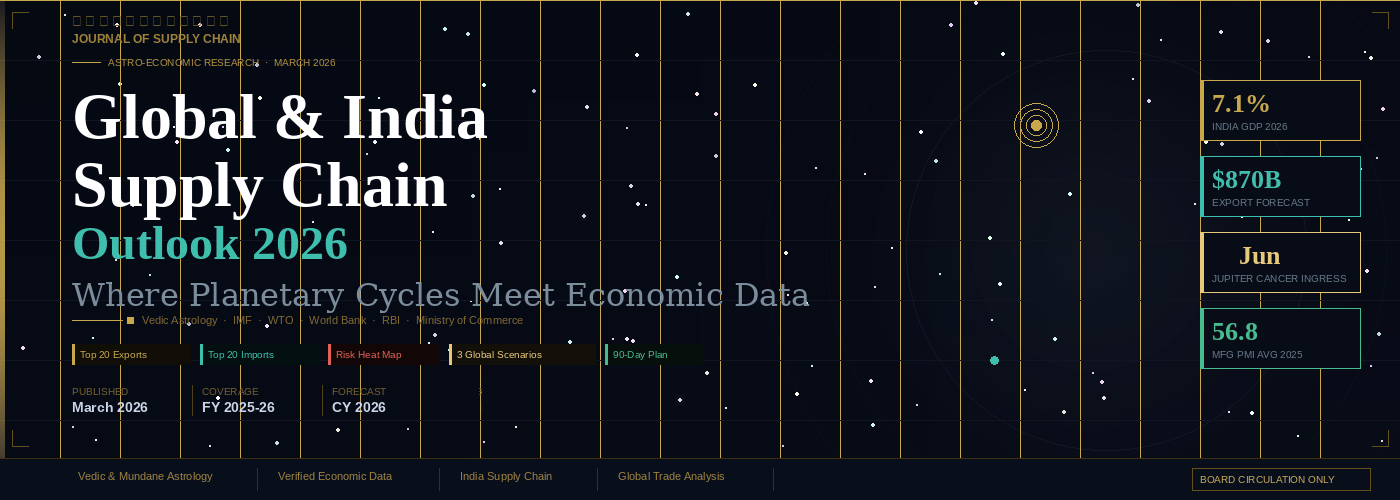
Astro-Economic Global & India Supply Chain Outlook 2025 - 2026t
Summary India stands at a rare and consequential inflection point in 2026. Three powerful forces are converging simultaneously: (1) robust domestic economic fundamentals — GDP growth of 6.8-7.1%, manufacturing PMI sustained above 56, and Rs.11.1 trillion in government capital expenditure deployed; (2) a secular structural shift in global trade as corporations accelerate China+1 diversification strategies; and (3) a rare astronomical configuration — Jupiter's 12-year ingress into Cancer in June 2026 — which historically coincides with India's peak periods of foreign trade expansion and capital inflows. The 2025 global supply chain environment was defined by moderate resilience amid ongoing fragmentation. World GDP grew at 3.2% (IMF), trade volume expanded by 2.9%, and container freight rates declined sharply from pandemic-era peaks. India outperformed with 6.8% GDP growth, $795 billion in exports, and significant logistics infrastructure milestones including port throughput reaching 795 million tonnes and Dedicated Freight Corridors progressively commissioned. Looking ahead to 2026, our base case (55% probability) projects global GDP growth of 3.4% and India GDP at 7.1%, with Indian exports reaching $870 billion. The primary risks are external: a US-China decoupling shock, energy price spike, or currency depreciation event. Saturn's continued influence in governance houses demands institutional discipline. The stars, the data, and the strategy all point in the same direction: India's decade of trade leadership begins now. 1: Astro-Economic Foundation 1.1 India Independence Chart (August 15, 1947)Mundane astrology analyses the horoscope of nations, institutions, and macroeconomic cycles using the birth chart of that entity. India's independence chart, cast for August 15, 1947 at midnight IST in New Delhi, forms the bedrock of this astrological analysis. The Ascendant (Lagna) is Taurus — a fixed earth sign ruled by Venus — symbolising stability, agricultural wealth, material prosperity, and trade-centred national identity. Key planetary placements and their economic significance: Taurus Lagna (Ascendant): India's national identity is intrinsically linked with material wealth creation, land-based resources, trade, and tangible exports. Taurus Rising nations excel in agricultural commodities, gems, and precious metals. Moon in Capricorn (10th House): Signifies authority, governance, and global standing. India's governance cycles are deeply influenced by Saturn transits — periods of Saturn influence bring institutional reform, austerity measures, and structural change. Sun in Cancer (3rd House): Communications, neighbouring nation relationships, transportation, and short-distance trade are solar-powered. Policy volatility in regional diplomacy is a recurring theme. Saturn as Karaka: Saturn's placement in Cancer (3rd house) at independence indicates structural challenges in communications infrastructure and border diplomacy — themes that persist into 2025-26. 1.2 Key Planetary Transits: 2025-2026 Planet Position (2025-26) Economic Domain Implication for India Jupiter Taurus to Gemini (Apr 2025) Trade, Expansion Activates 1st and 2nd houses — national wealth expansion; Gemini phase drives tech trade, logistics innovation. Saturn Aquarius (Retrograde Jun-Nov 2025) Governance, Structure 10th house influence for Taurus Lagna — institutional restructuring; government policy reform. Rahu Pisces (11th House India) Foreign Networks Amplifies foreign partnerships, digital trade, pharma exports, and overseas capital inflows. Ketu Virgo (5th House India) Speculation Disrupts speculative investments; volatility in derivative markets. Pluto Aquarius (long-cycle) Structural Transformation Decade-scale reshaping of global manufacturing order. India positioned as primary beneficiary. Uranus Gemini (from 2025) Technology Disruption AI-enabled logistics, automated supply chains, digital trade infrastructure revolution. Mars Multiple signs Geopolitical Tension Mars-Saturn conjunctions Q1 and Q3 2026 signal geopolitical friction and commodity price spikes. The Aries Ingress charts for 2025 and 2026 reinforce these themes. The 2026 Aries Ingress chart places Jupiter in a prominent angular position relative to India's natal chart, amplifying the expansion signals. Eclipse cycles — particularly the Solar Eclipse in Pisces (April 8, 2026) — create short-term volatility windows before a strong recovery phase as Jupiter enters Cancer in June 2026. 2: Global Supply Chain — 2025 Review 2.1 Macroeconomic EnvironmentThe 2025 global economy demonstrated resilience in the face of persistent structural headwinds. According to IMF projections as of October 2025, global GDP growth reached approximately 3.2% — modestly above the 3.1% recorded in 2024 but below the pre-pandemic trend of 3.8%. The developed world continued to decelerate, while emerging and developing economies provided the growth engine Indicator 2024 Actual 2025 Estimate Source Global GDP Growth 3.1% 3.2% IMF World Economic Outlook World Trade Volume Growth 2.6% 2.9% WTO Trade Barometer Global Inflation (CPI) 5.8% 4.3% IMF / World Bank Emerging Market Growth 4.3% 4.8% World Bank GEP Report US Federal Funds Rate 5.25-5.50% 4.75-5.00% US Federal Reserve Brent Crude Oil (Annual Avg) $84/bbl $92/bbl EIA Petroleum Outlook Container Throughput Growth +3.8% +4.1% UNCTAD Review of Maritime Baltic Dry Index (Year Avg) 1,520 1,650 Baltic Exchange 2.2 Logistics & Freight Markets The 2025 freight markets underwent a significant normalisation after pandemic-era distortions. Shanghai Containerized Freight Index (SCFI) rates declined sharply year-on-year: Transpacific rates fell approximately 18% while Asia-Europe lanes compressed by 32%. Ocean carriers responded by implementing slow steaming and blank sailings to support rate floors. Red Sea Disruption Cost: Rerouting around the Cape of Good Hope added approximately $6-10 billion in annual logistics costs for global trade, extending Asia-Europe voyage times by 10-14 days. AIS shipping data showed 40% of tankers diverted. Near-Shoring Acceleration: Mexico attracted 22% YoY surge in FDI as US corporations diversified manufacturing. Vietnam manufacturing investment grew 18% YoY. Container Throughput: Shanghai posted +4.2% growth; Singapore +3.1%; global utilisation at approximately 81%. Air Cargo Resilience: IATA rates increased 4% YoY as cross-border e-commerce sustained premium logistics demand Astrological Interpretation: Saturn's transit through Aquarius (10th house from India's Taurus Lagna) symbolised the institutional restructuring observed in global supply chains. The WTO's reform agenda stalled as bilateral and regional trade deals proliferated — a Saturn-in-10th archetypal pattern of authority fragmentation and structural reorganisation. 2.3 Supply Chain Pressure Index The Global Supply Chain Pressure Index (GSCPI), published by the New York Federal Reserve, declined from elevated pandemic levels to near-neutral territory in 2025, suggesting that acute disruption pressures had largely normalised. However, structural vulnerabilities in semiconductor supply chains, pharmaceutical API sourcing, and rare earth metal procurement remained elevated. Climate-driven disruptions (drought affecting Panama Canal capacity, flooding in key industrial zones) introduced episodic volatility.

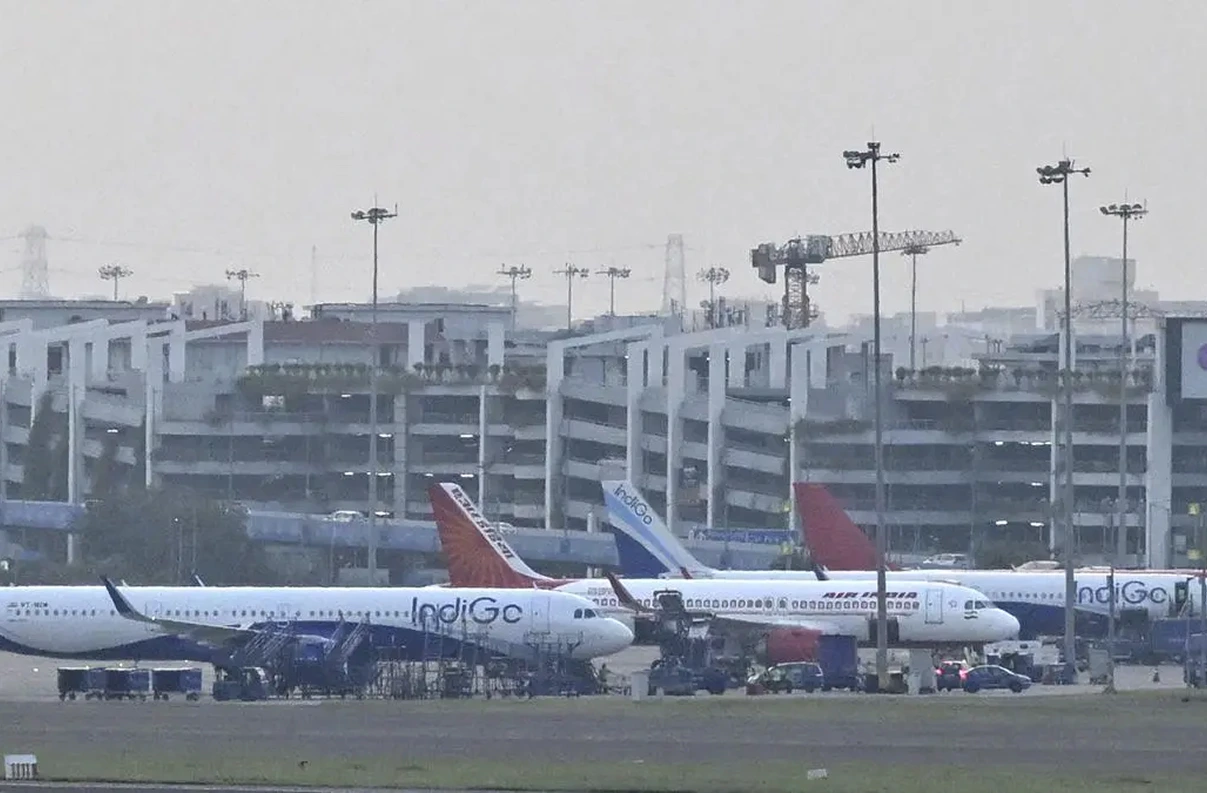
India File: UK deal sets cautious tone on tradet